Main page for this laboratory is here. Scroll down for the procedure. Of special interest are the Data Spreadsheet for Wind Tunnel Test and Lift, Drag and Wind Tunnel Testing (instructor’s handout.)
Other resources:
- Computing Lift and Drag Coefficients, some useful information on a subject where errors take place
- NASA Beginners Guide to Wind Tunnels
- Pressure Distribution on Buildings (an example of a wind tunnel testing program, perhaps you’d like to try a building model)
- Aerodynamic Characteristics of NACA 0012 Airfoil Section at Angles of Attack from 0 deg. to 180 deg.
- Climate Data for Design of Aviation and Other Equipment
- The Last Supper, the Iranians and the Perfect Dissertation. A story of people involved in Computational Fluid Dynamics.
Procedure
Objectives:
- To examine the drag characteristics of a sphere at varying Reynolds numbers.
- To examine the drag characteristics of multiple spheres, each having the same diameter but varying surface roughness characteristics, versus Reynolds number.
- To examine the drag and lift characteristics of a NACA 0012 airfoil at varying angle of attack and Reynolds Number.
- To examine the drag (and lift depending upon the object) characteristics of multiple models at varying Reynolds Number.
- To enable the student to know as many Reynolds Numbers as possible.
Introduction:
A non-rotating symmetrical body, such as a sphere, will experience a drag force when placed in a flowing fluid. This force, which is tangential to the direction of the flow, is the result of a pressure distribution over the surface of the object often referred to as form drag, and viscous effects known as skin friction. When an object is not symmetric a second force called lift, which is normal to the direction of the flow, will also occur. Like the drag force the lift force also results from the pressure distribution and viscous effects.
Theory and Wind Tunnel Basics
The theory behind the wind tunnel is covered in the instructor’s handout “Lift, Drag and Wind Tunnel Testing” on his website, along with some discussion of errors, both in the wind tunnel and in the students’ reports.
Test Procedure
Most of the explanation of the operation of the wind tunnel is done in the instructor’s video. You will perform tests on the following objects:
- Tests on one or more spherical objects (or spherically related objects) for drag coefficient. This is done for a series of speeds up to 55 MPH. Unless otherwise specified, the sphere we use in the lab has a diameter of 2 ½”, and the teardrop sphere 2 ⅛”.
- Tests on the NACA0012 airfoil for both lift and drag coefficients. You will do this for two different air speeds and a series of angles of attack. The chord of the airfoil is 2 1/2″ and the span is 10″.
The airspeeds you use and the results you need to collect are in the data spreadsheet for this experiment.
You will then write a report which will include the following:
- Title Page
- Objective of the experiment
- Outline of the theory behind wind tunnel testing and the determination of lift and drag coefficients.
- Brief description of the testing procedure for the spherical objects and the airfoil, along with a description of the test apparatus.
- Observed data for both types of objects, including airspeed, drag (and lift force for the airfoil,) and basic dimensions (sphere diameter, chord and span for the airfoil. etc.)
- Data reduction and plot of Cd versus Reynolds Number for the spherical objects. Included with this should be comparison with published data. The two objects should be plotted on one (1) plot for comparison purposes.
- Data reduction and plot of Cd and CL versus angle of attack for the NACA 0012 airfoil for at least two (2) sets of Reynolds and Mach numbers (airspeeds.)
- Discussion of the results.
- Conclusion
- Appendix. The appendix should include a detailed example of how you reduced wind speed vs. force on the object to drag (and lift, with the airfoil) vs. Reynolds number.
- References (you will need some of these.)
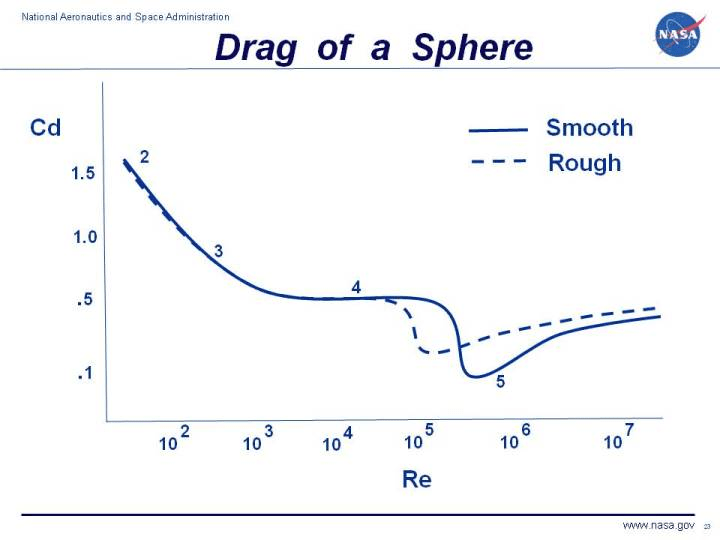
If you find it helpful, typical data for drag coefficients on a sphere are shown in Figure 1.