
Links to all of the Fluid Mechanics Laboratory experiments are here. Scroll down for the procedure. Other resources relating to this laboratory are here:
- Chet’s Propellers: How Did They Work? (Instructor’s Handout)
- Mirroring Our Creator. We really do, in a number of ways.
Procedure
Noted above, the theory behind the experiment is here: Chet’s Propellers: How Did They Work? (Instructor’s Handout). You will need the Data Spreadsheet for the Experiment. One of the tricky parts of this experiment is reducing the pitot-static tube data, and some discussion of this follows.
The test stand and apparatus is shown in Figure 1.
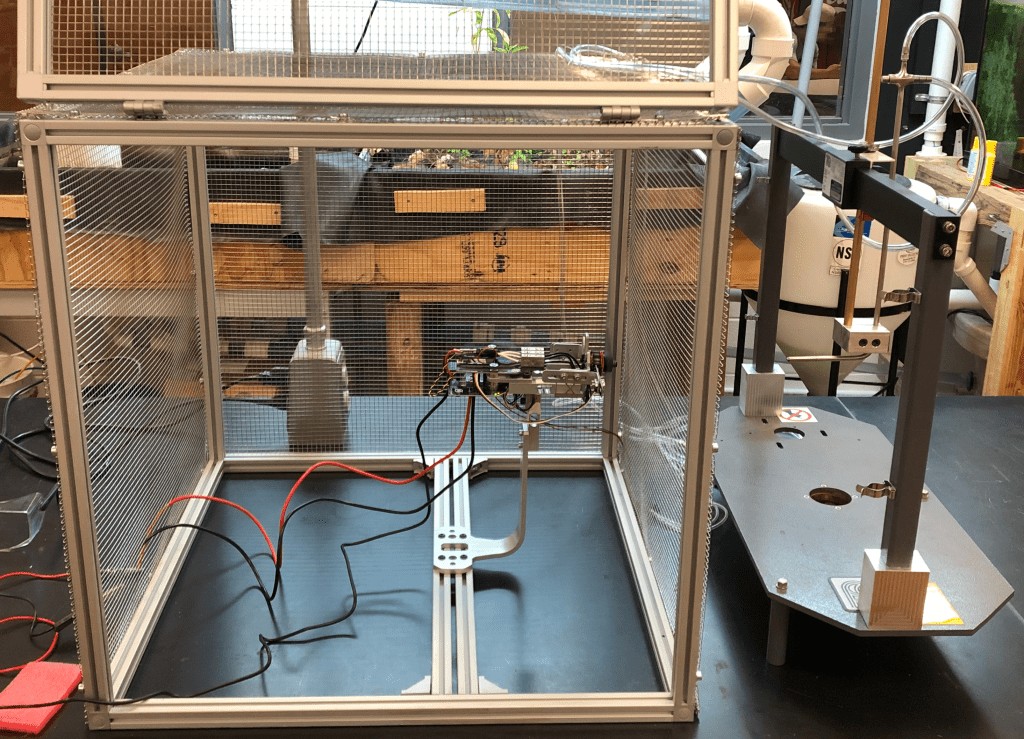
To better display the test stand, the door of the safety cage is open. That door should never be open while the apparatus is in operation. To the right of the test stand is the traverse, with the pitot-static tube. The traverse is moved left and right (fore and aft in the photo) to measure the velocity at different points in front of the propeller. To the left (not shown) is the power supply and the computer which controls the apparatus and displays/records the data.
The test stand is controlled by computer software which communicates with the test stand via a USB port. A sample panel is shown in Figure 2.

Getting the RCBenchmark GUI Started:
- Make sure the USB cable from the test stand is connected to the computer.
- Open the RCBenchmark GUI
- On the left tab, connect the “COM3” dropdown menu.
- Select the “Utilities” tab. Select the firmware to be paired for the Series 1585 thrust stand.
- Select the Manual Control Tab (as shown in Figure 2.)
- Check the appropriate data readings: Airspeed, RPM, Thrust.
- Tare both the load cells and the airspeed by pressing the buttons to do that on the left. Also make sure that the test stand thrust reading is in Newtons.
- Verify the diameter of the propeller. For the apparatus shown in Figure 1, that diameter is 203.5 mm.
- Slowly raise the slider to the desired RPM. For the apparatus shown above, that speed is 5000 RPM. Pay attention to not exceed 12V or 10A. Ensure that the voltage switch on the back of the power supply is set to 12V. Do not exceed the RPM specified for the device.
- Make sure that, as you move the slide, the elevation of the pitot-static tube remains constant and that the pitot-static tube is perfectly perpendicular to the cage.
Laboratory Procedure
Note: Groups will use different props which will be spun at two different speeds: 5000 RPM and 6000 RPM
- Group 1: _” x _” propeller
- Group 2: _” x _” propeller
- Group 3: _” x _” propeller
- Group 4: _” x _” propeller
- When the propeller has achieved nearly 5000 RPM, record the measured thrust.
- Center the pressure measurement system in the vertical direction, so that the pitot-static tube is level with the centre axis of the propeller. Move the slider to the leftmost measurement for the apparatus in use. For the apparatus shown, that distance is 12 cm from the centre axis of the propeller. There is a data spreadsheet for this experiment; you can use that to make sure you’re getting all of the data points that you need.
- With the propeller continuing to rotate at the specified RPM, record the airspeed reading.
- Move the pressure measurement traverse in the specified horizontal increments and repeat step 3 until all measurements are recorded. For the apparatus shown, that increment is 2 cm.
- Increase the rotational speed to 6000 RPM and repeat the data collection.
It is possible to set the computer to record the data using a CSV file; you’ll need a flash drive to get this data off of the computer.
For the basic data, the results you record from the traverse should be tabulated as follows:
| Distance from Centreline of Propeller, cm | Velocity, m/sec |
| 12 | |
| 10 | |
| 8 | |
| 6 | |
| 4 | |
| 2 | |
| 0 | |
| -2 | |
| -4 | |
| -6 | |
| -8 | |
| -10 | |
| -12 |
Integrated Method of Computing Propeller Thrust
To compute the thrust of the propeller, we will use an integrated approach. This is done through the following equation,
 | (1.1) |
where,
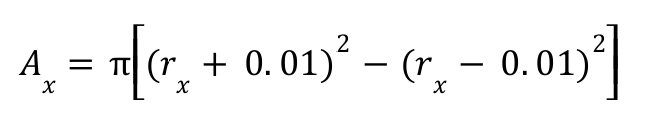 | (1.2) |
This now allows the area of each velocity to be measured in the annulus, or “disk”, shaped profiles. Using this formula allows the measured velocity to be scaled up or down based on how much of the velocity profile it covers. Figure 3 shows how the annulus area scales the velocity readings based on the area they cover.

Once you’ve gathered the data, proceed as follows:
- Average the velocity for each annulus. For example, if you have a velocity for +12 cm and one for -12 cm, average these to obtain an average velocity.
- Compute the thrust for each annulus. Do this using the method shown in Chet’s Propellers: How Did They Work? (Instructor’s Handout).
- Sum all of the thrusts for all of the annuli.
- Compare this result to the thrust from the test stand itself.
Nomenclature:
- p = Pressure (Pa)
- γ = Specific Weight
- g = Gravity (9. 81 m/sec2 )
- z = Elevation Above Reference Plane, m
- V = Average Velocity (m/sec )
- F = Thrust (N)
- ρ = Density, kg/m3
- R = Propeller Radius (m)
What to Include in the Report
- A title sheet
- The main body containing the following sections:
- Objective(s): What was the purpose of the experiment?
- Theory: Present a brief summary of the theory behind the momentum equation as it is applied to propellers.
- Procedure: Summarise the procedure in a form that shows you understand the basics without getting into lengthy details.
- Observed Data: Put the data into tabular form, with units. Also include a few sentences to orient the reader.
- Results/Discussion: Present and discuss the results of your measurements. You need to show how you calculate the thrust for each ring, the total thrust from the rings, and how it compares with the thrust from the test stand. How do the theoretical and actual values compare? What do you think were likely sources of error? Consider the assumptions that you’ve made. You’ll also need to plot the ring thrust against the distance from the centre of the propeller. Froude’s theory states that, inside the thrust area of the propeller, the velocity should be uniform. Is it? Are there differences? Why do these exist?
- Conclusions: What did you learn? Did you accomplish your objectives? How well did your theoretical and experimental values compare? Can you identify any limitations of this experiment? Do you have any recommendations?
- Appendix: Include the raw data sheet here. Also, show sample calculations for your theoretical height and velocity profiles.
- References: Include any references cited here. Make sure you only add the references you cite in the text.
